Interactive: Features such as Hints, Mouse Tracking, Mouse Events, Key Tracking and Events, Zooming, Scrolling, and Crosshairs raise interactivity and user experience in web charting to a new level.
Axis Scaling: There’s no need to determine your data range before hand. EJSChart will calculate and scale automatically to fit whatever data it is presented with.
Auto Zooming, Scrolling: Too much data and not enough screen real estate? Show it all. Let your end users zoom in on the pieces they’re most interested in. Axis locking for single axis zoom, scrolling and automatic axis scaling are all included.
Stackable Series: Multiple chart series can be stacked and combined to fit many charting needs.
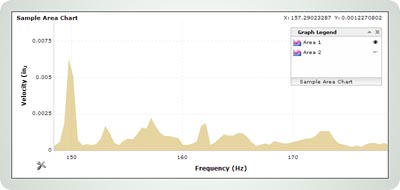
Multiple Chart Types: Line, Area, Scatter, Pie, Bar and Function series are just the beginning. New series are just a few lines of JavaScript code away.
Ajax-Driven Data: EJSChart supports XML-formatted data and loads data on the fly. New series can be added and data updated in real time without page reloads.
Compatible: Built with compatibility in mind and tested on all major browsers, you can be assured your charts will function consistently for the broadest range of end users.
See the full list of compatible browsers.
Plugin Free: 100% Pure JavaScript Charting Solution. No more worries of incompatible plugin versions or confusing security warnings. EJSChart is pure JavaScript and requires no client installation.
Customizable: Every aspect of the charting display can be configured and customized through well-documented properties and methods. Want to do more than just change the color of the background? Need a series type which doesn’t already exist? EJSChart is fully customizable and extendable to provide the greatest flexibility and integration for existing site designs and needs.
 Axis Scaling: There’s no need to determine your data range before hand. EJSChart will calculate and scale automatically to fit whatever data it is presented with.
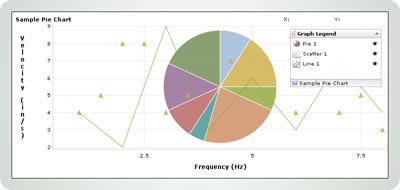 Stackable Series: Multiple chart series can be stacked and combined to fit many charting needs.